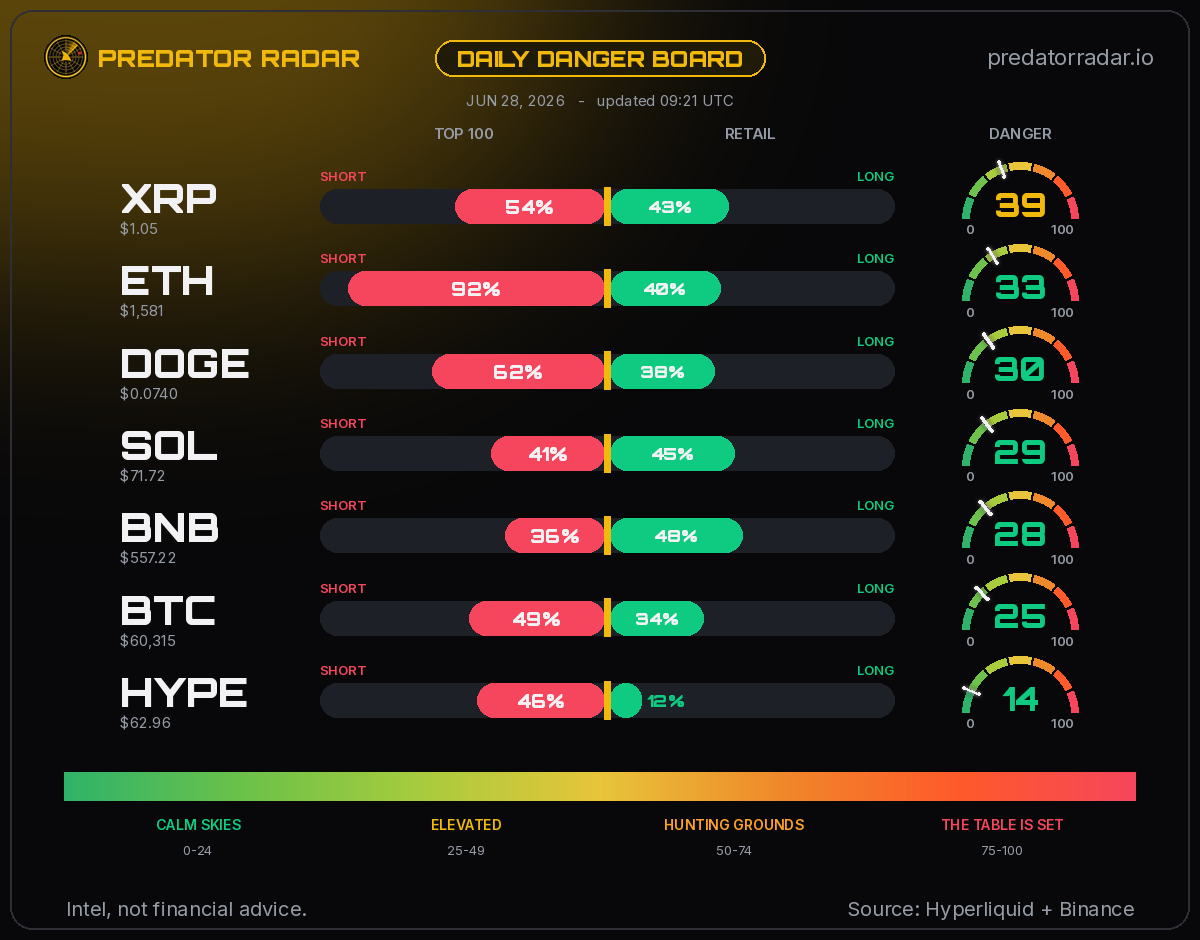
Tool 1 · the danger board

Predator Radar

One number, 0–100, that answers a single question: how dangerous is this pair right now? It measures where the TOP 100 wallets line up against retail — and flags the pairs where retail is about to become someone's exit liquidity.

Live · the danger board

Who is hunting, right now.

The same whale-vs-retail score we post every day — live, all seven pairs.

Intel, not financial advice · read-only Hyperliquid + Binance public data. Auto-refreshes every minute.

Live markets LIVE

The tape, live.

The danger board above reads who's positioned where; the chart below is the tape it plays out on — real-time prices on every pair we score.

Live prices via TradingView — free, no account needed. Charts show price only; our danger score is the read on positioning, above.

Daily danger board
The daily danger board — posted free, every day
How it works

Whale-vs-crowd, four signals.

D

Divergence — 40%

How hard the top wallets lean against retail.

F

Funding — 20%

What one side pays to hold: the cost of the crowd's conviction.

C

Crowding — 20%

How one-sided the retail book has become.

O

OI surge — 20%

How fast open interest is piling in.

Read-only Hyperliquid + Binance public data. TOP 100 = the 100 biggest wallets by 30-day PnL; retail is the next 2,000. Pairs: BTC, ETH, SOL, BNB, XRP, HYPE, DOGE.

How to read the board

The color is the danger. The bars are the sides.

● CALM 0–24
green · calm skies, the book is quiet
● ELEVATED 25–49
gold · positioning is building
● HUNTING 50–74
amber · hunting grounds, the trap is set
● THE TABLE IS SET 75+
red · the book is loaded, max danger

The color is the danger level, NOT a direction — red does not mean bearish, it means the book is loaded and someone is about to get hunted. The tug-of-war under each tile shows the sides: green = that group is net long, red = net short. TOP 100 / TOP 250 = the biggest whales; RETAIL = the crowd. When they oppose, someone is the exit liquidity. All facts from read-only data — what you do with them is your call.

Example — how to read it

SOL hits 71, and the tile glows red. 71 means hunting grounds — the danger is high, regardless of direction. Under it, the tug-of-war shows the top wallets 62% short ($510M across 11 wallets) in red, pulling left, while the retail crowd sits 41% long in green, pulling right — opposite sides, so short squeeze or longs flush incoming. We show you where everyone stands; the trade is yours. Intel, not financial advice.